Dashboard

Telemetry for STORE-A: people flow, zones, and packaged visuals. Data last row date: 2026-04-03.

Visitor today (unique)

184

Latest day in feed

Area Traffic

6,815

People around the area

Entrance Rate

2.7%

How many people entered

People this month

549

Including repeat visitors

People year-to-date

1,224

All rows in data

Physical assets tracked

8

Rows in assets inventory

Hotspots

Zones where people and assets tend to linger or stack (illustrative copy).

  • Checkout A concourseSustained dwell 10:00–13:00; strong repeat paths from main entry beacons.
  • Receiving dock laneForklifts and foot traffic overlap; brief spikes align with trailer arrivals.
  • Cold storage entry airlockShort visits but high throughput; good candidate for quick-help signage tests.

Coldzones

Quieter pockets worth a second look before changing layout or staffing.

  • Upper mezzanine overlookSparse presence after 11:00; consider guided tours or seasonal displays.
  • Returns cage rear cornerLow net counts; verify sensor sightlines and lighting for confidence.
  • Back office corridorStaff-only pattern; keep baselines separate from public heatmaps in reports.

PLS visuals

Securitrack

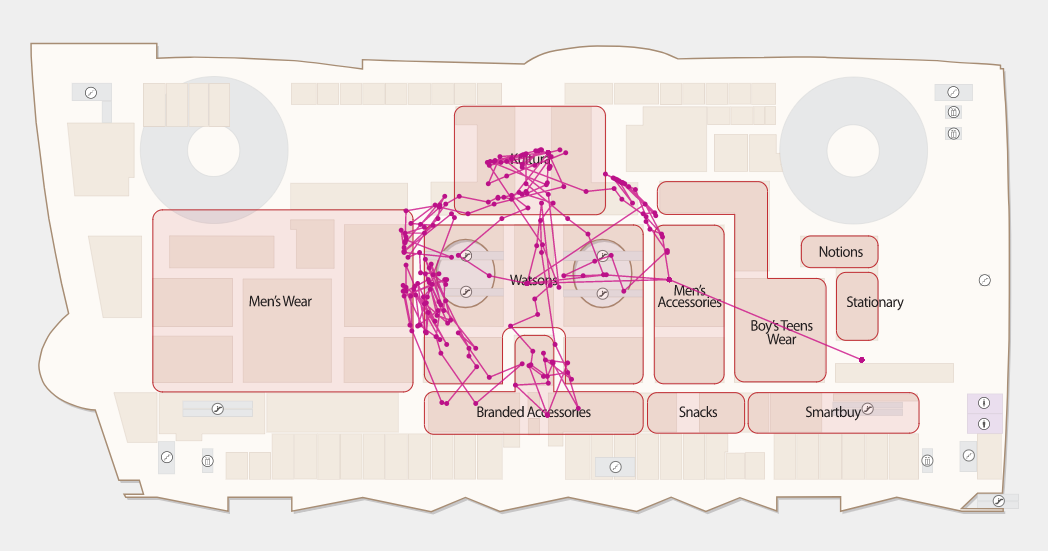
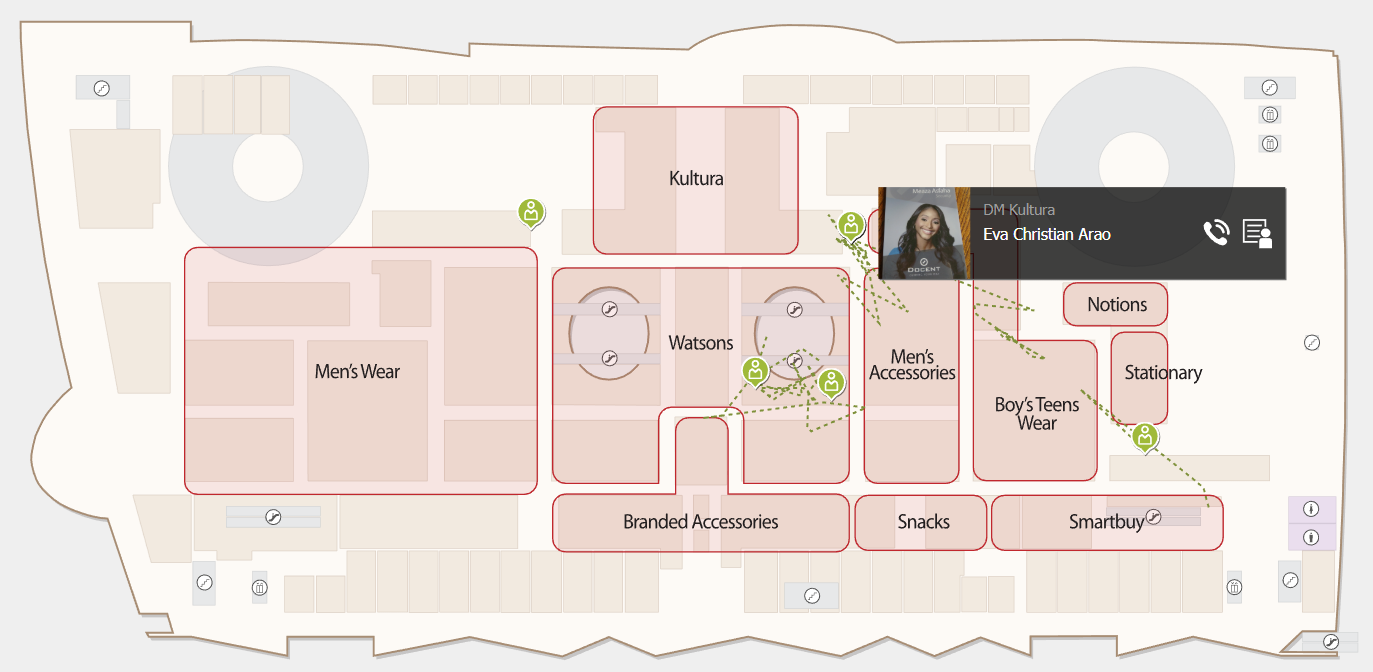
Live-style floor composite; click to open the personnel map.

Securitrack floor composite

Chromap

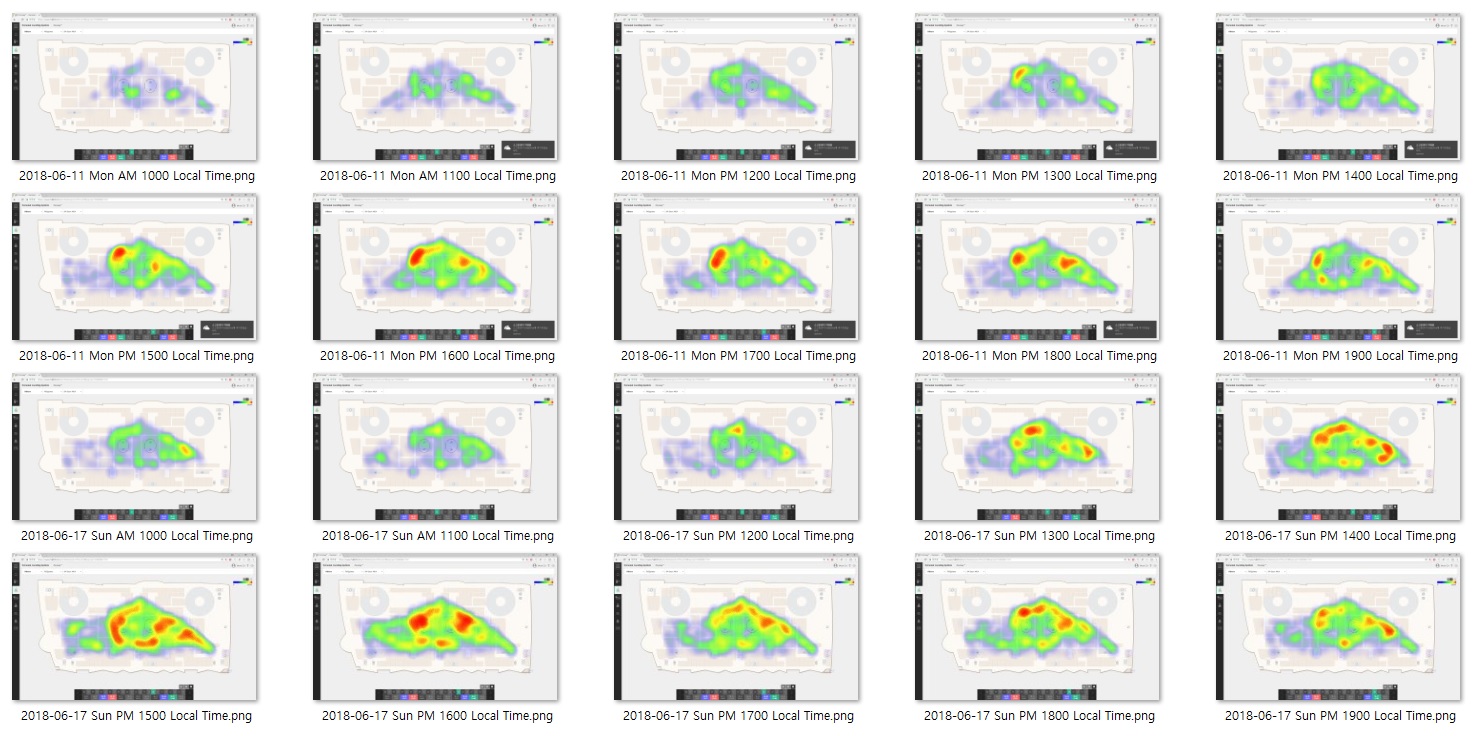
Heat-style composite; open a crisp snapshot for briefings.

Chromap daily composite heatmap

Routograph

Rotating route archetypes derived from path classes.

Report

Visitor analytics cover page; open the PDF in a focused reader.

Report cover iconOpen sample PDF

Recent conversations

Example topics — start a chat to see your own history.

  • Entrance rate vs last Tuesday
  • Cold zone staffing ideas
  • Monthly visitor summary tone
  • Asset checkout compliance
  • Heatmap story for executives
Talk to Data

Open the AI assistant to explore your visitor and asset data interactively.